Project Management
& Task Tracking Dashboard
IQHQ — USA
The Challenge
40+ Projects Managed Through Jira, Status Emails, and Guesswork
IQHQ's project teams were using Jira for task tracking — but Jira was disconnected from the rest of the organisation's Microsoft 365 environment. Project managers were manually compiling weekly status update emails by reviewing Jira boards and writing summaries, a process that consumed 5+ hours per week per PM. Leadership had no consolidated view of portfolio health without requesting a report.
Resource allocation across the 40+ concurrent projects was essentially guesswork. There was no system showing which team members were assigned to which projects, how loaded they were, or which projects were at risk of resource constraints. Milestone tracking was done in separate Excel files that weren't linked to the actual task boards.
The organisation wanted to replace the Jira + Excel + email combination with a unified project management dashboard that lived inside SharePoint — where PMs, team members, and leadership could all have appropriate views without switching between tools.
5+ hours per PM per week writing manual status update emails by reviewing Jira boards
Leadership had no consolidated portfolio view — required requesting a report to see project health
Resource allocation was guesswork — no visibility into team member load across 40+ projects
Milestone tracking in separate Excel files with no link to task boards — always out of date
Dashboard Modules Built
Six Views That Replace Five Tools
The Solution
A SharePoint-Native PM Dashboard That Leadership Uses in Board Meetings
Akshara Technologies built a comprehensive project management dashboard as a set of interconnected SPFx web parts deployed on a dedicated SharePoint project management hub. All project data is stored in SharePoint Lists — projects, tasks, milestones, assignments, and status logs — giving the system a familiar, IT-supported data layer with no additional infrastructure.
The portfolio overview is the leadership view: a grid of all active projects with colour-coded health indicators, key metrics, and one-click drill-down into any individual project. The project-level view shows the kanban task board, milestone timeline, resource allocation chart, and risk register side by side. Team members see only their assigned tasks and relevant project information.
Power Automate handles all reporting automation. A weekly flow runs every Monday morning, generates an HTML status email for each active project, populates it with the latest SharePoint List data, and sends it to the relevant stakeholders — without any PM manually writing a word. Overdue milestone alerts fire automatically when a milestone passes its due date without being marked complete.
What Was Delivered
Measured Outcomes
Portfolio Visibility From Jira to the Boardroom
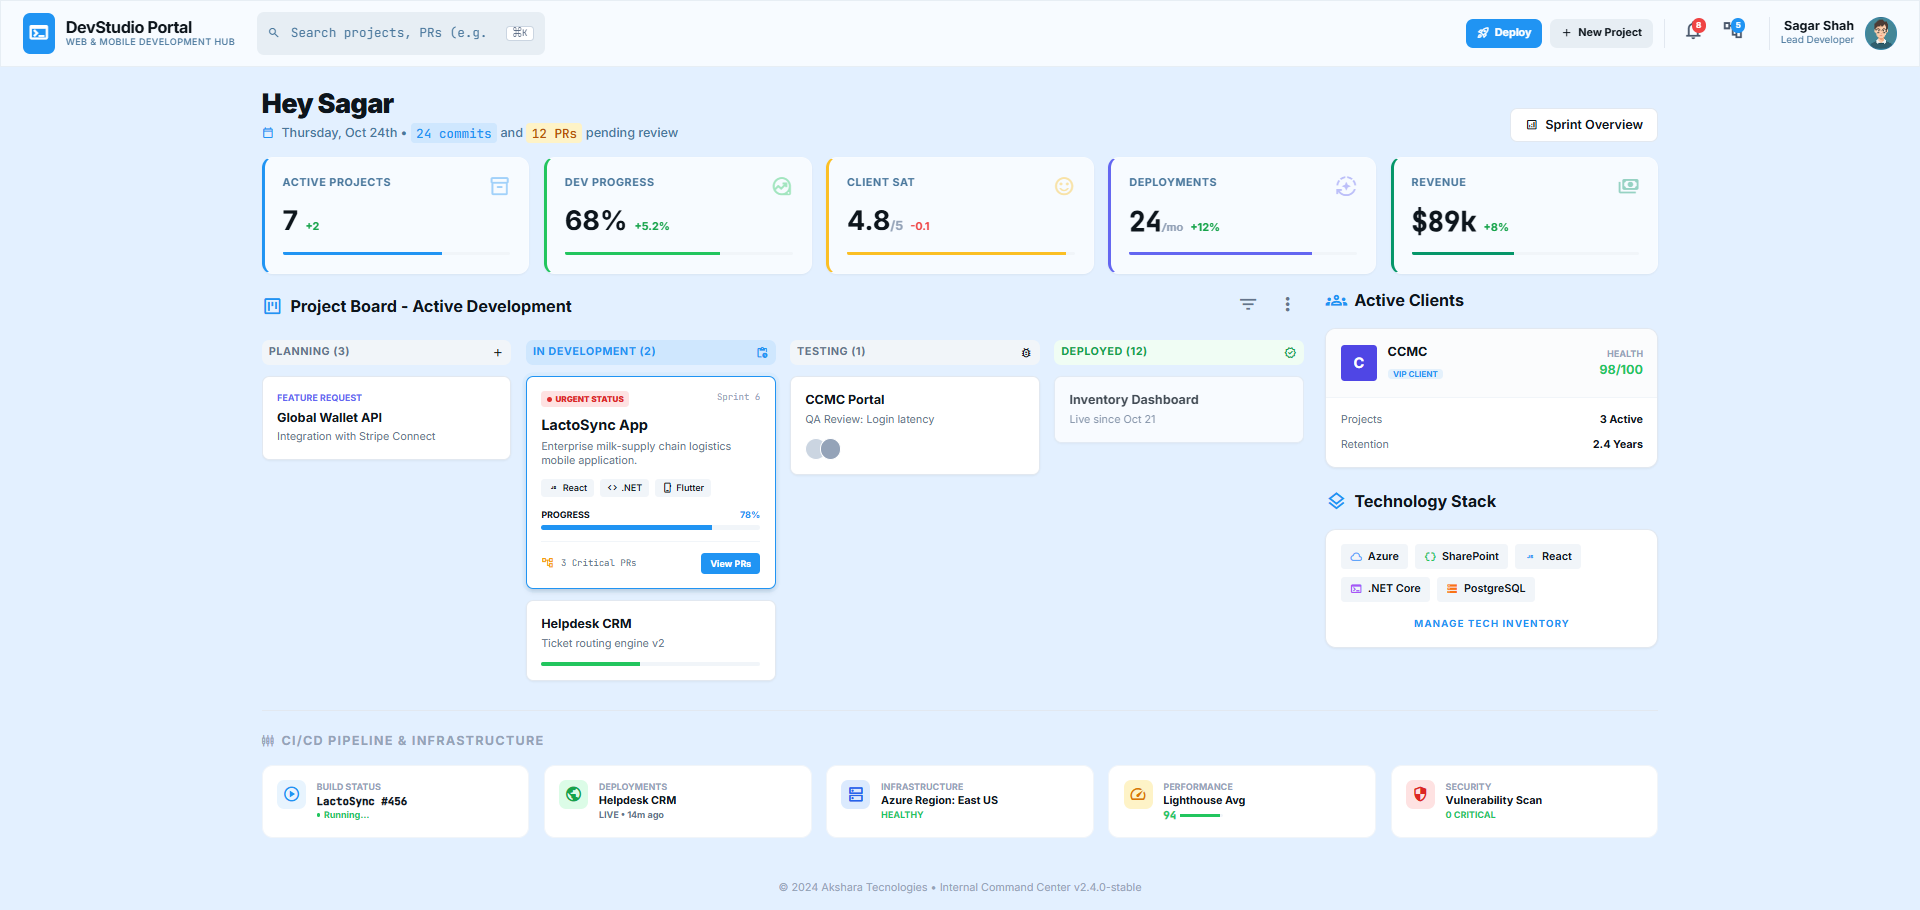
Project Screenshots
The PM Dashboard in Action
Technology Stack
Tools & Technologies Used
Start Your Project
Replace Jira + Excel + Email
with One SharePoint Dashboard
If your project reporting is a manual overhead and your leadership portfolio view is always a week out of date, let's build you a SharePoint-native PM system that changes that.