Interactive Organisation
Chart Web Part
Enterprise Clients
The Challenge
Static PowerPoint Org Charts That Go Out of Date Overnight
Across enterprise clients, the organisation chart was an afterthought — usually a PowerPoint slide deck or Visio file maintained by a single HR administrator. Every time someone joined, left, was promoted, or changed teams, the chart needed a manual update. In practice, those updates happened quarterly at best and were nearly always out of date.
New employees had no way to understand the reporting structure of the organisation they had just joined. Managers could not see who reported to whom across departments without chasing HR. The chart, when shared at all, was distributed as a PDF attachment to an email — no interactivity, no drill-down, no ability to click on a person to get their contact details or reach out directly.
The data needed to build an accurate, always-current org chart was already in Azure AD — the reporting lines, manager assignments, department memberships, and profile photos were all there. The challenge was building a web part that could turn that data into a beautiful, interactive visual that employees would actually want to use.
Static PowerPoint or PDF org charts — outdated within days, no interactivity, no drill-down
Manual maintenance burden — every personnel change required HR to update and redistribute the file
No employee profile links — viewing the chart gave you a name but no way to contact the person
No connection to live data — chart was a snapshot, not a reflection of the actual current organisation
The Solution
D3.js Org Chart Web Part with Live Graph API Data
Akshara Technologies built an interactive organisation chart SPFx web part powered by D3.js and Microsoft Graph API. On load, the web part fetches the complete reporting hierarchy from Azure AD via Graph, constructs the tree data structure, and renders it as a fully interactive D3.js visualisation directly on the SharePoint page.
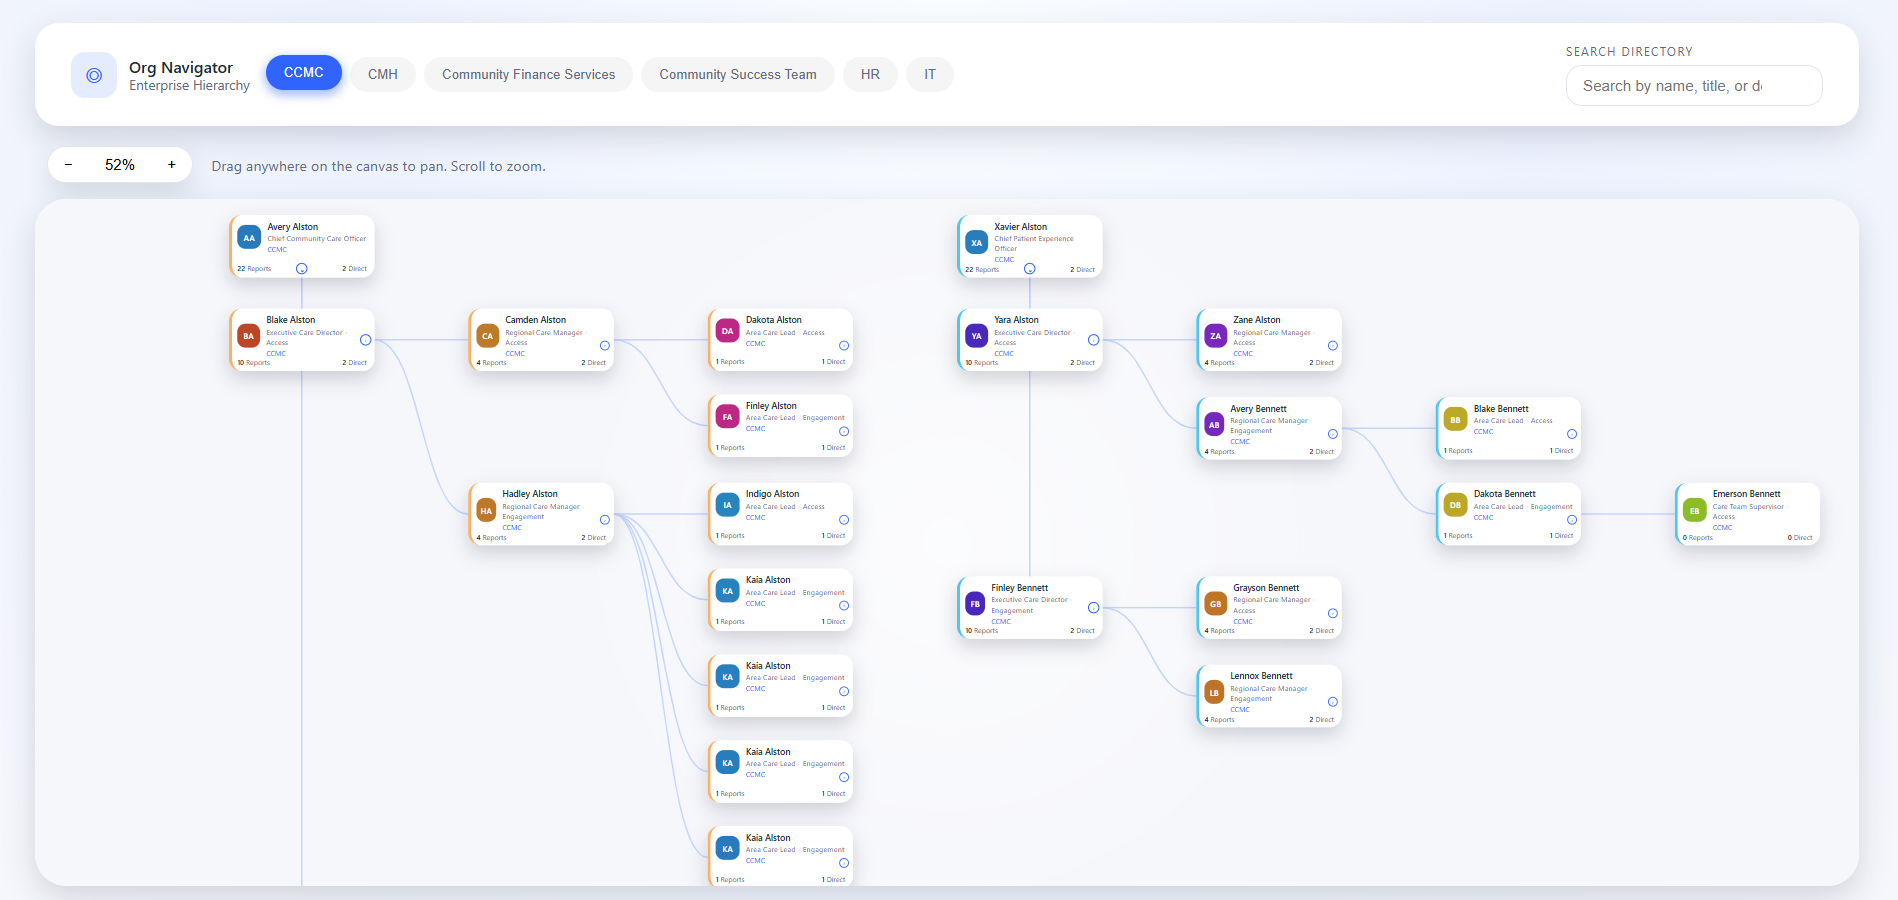
Users can drill down by clicking any node in the chart — the view smoothly transitions to show that person's direct reports and their sub-tree. Navigating back up the chain is handled by breadcrumb navigation at the top of the chart. Department colour coding is applied automatically based on Azure AD department data, making it immediately clear which teams belong to which function.
Each node in the chart shows the employee's profile photo, name, and job title. Clicking the node opens a profile panel with contact details and direct links to start a Teams chat or send an email — turning the org chart from a passive reference into an active communication tool. The web part is packaged as a tenant-deployable SPFx solution, usable on any SharePoint site across the tenant.
What Was Delivered
Measured Outcomes
Always Up to Date, Zero Maintenance
Project Screenshots
The Organisation Chart in Action
Technology Stack
Tools & Technologies Used
Start Your Project
Replace Your Static
Org Chart Today
We deploy our interactive D3.js org chart web part to your Microsoft 365 tenant — always current from Azure AD, drill-down navigation, zero maintenance required.