Halden Infrastructure —
£221.9M Portfolio in One Control Hub
Halden Infrastructure Capital — Leeds & Manchester, UK
The Challenge
Twelve Capital Projects, No Single View of Portfolio Health or Spend
Halden Infrastructure Capital manages a portfolio of civil and structural projects across the UK, spanning flood defence, transport, and utilities infrastructure. With 12 live projects at any time across two offices in Leeds and Manchester, the programme directors had no consolidated view of portfolio-level spend, milestone progress, or risk exposure.
Each project team maintained its own tracking: some used spreadsheets, some used MS Project files, some used project notebooks shared over email. The RAID log (risks, assumptions, issues, dependencies) existed as a shared Excel file that was saved with different names by different people, with no version control. Gate review dates were tracked in individual Outlook calendars.
At board level, a monthly portfolio report was assembled manually from inputs sent by each project manager — a process that typically took two days, produced a report that was immediately stale, and gave no early warning when a project was drifting from baseline spend or milestone plans.
No portfolio-level spend vs baseline view — each project tracked spend separately with no roll-up
RAID log maintained in a shared Excel file — version conflicts, no single source of truth for red risks
Gate review dates scattered across individual Outlook calendars — no programme-level gate schedule
Monthly portfolio report took two days to assemble manually — always stale by the time it reached the board
The Solution
A Capital Portfolio Hub Built on SharePoint Online and Power BI
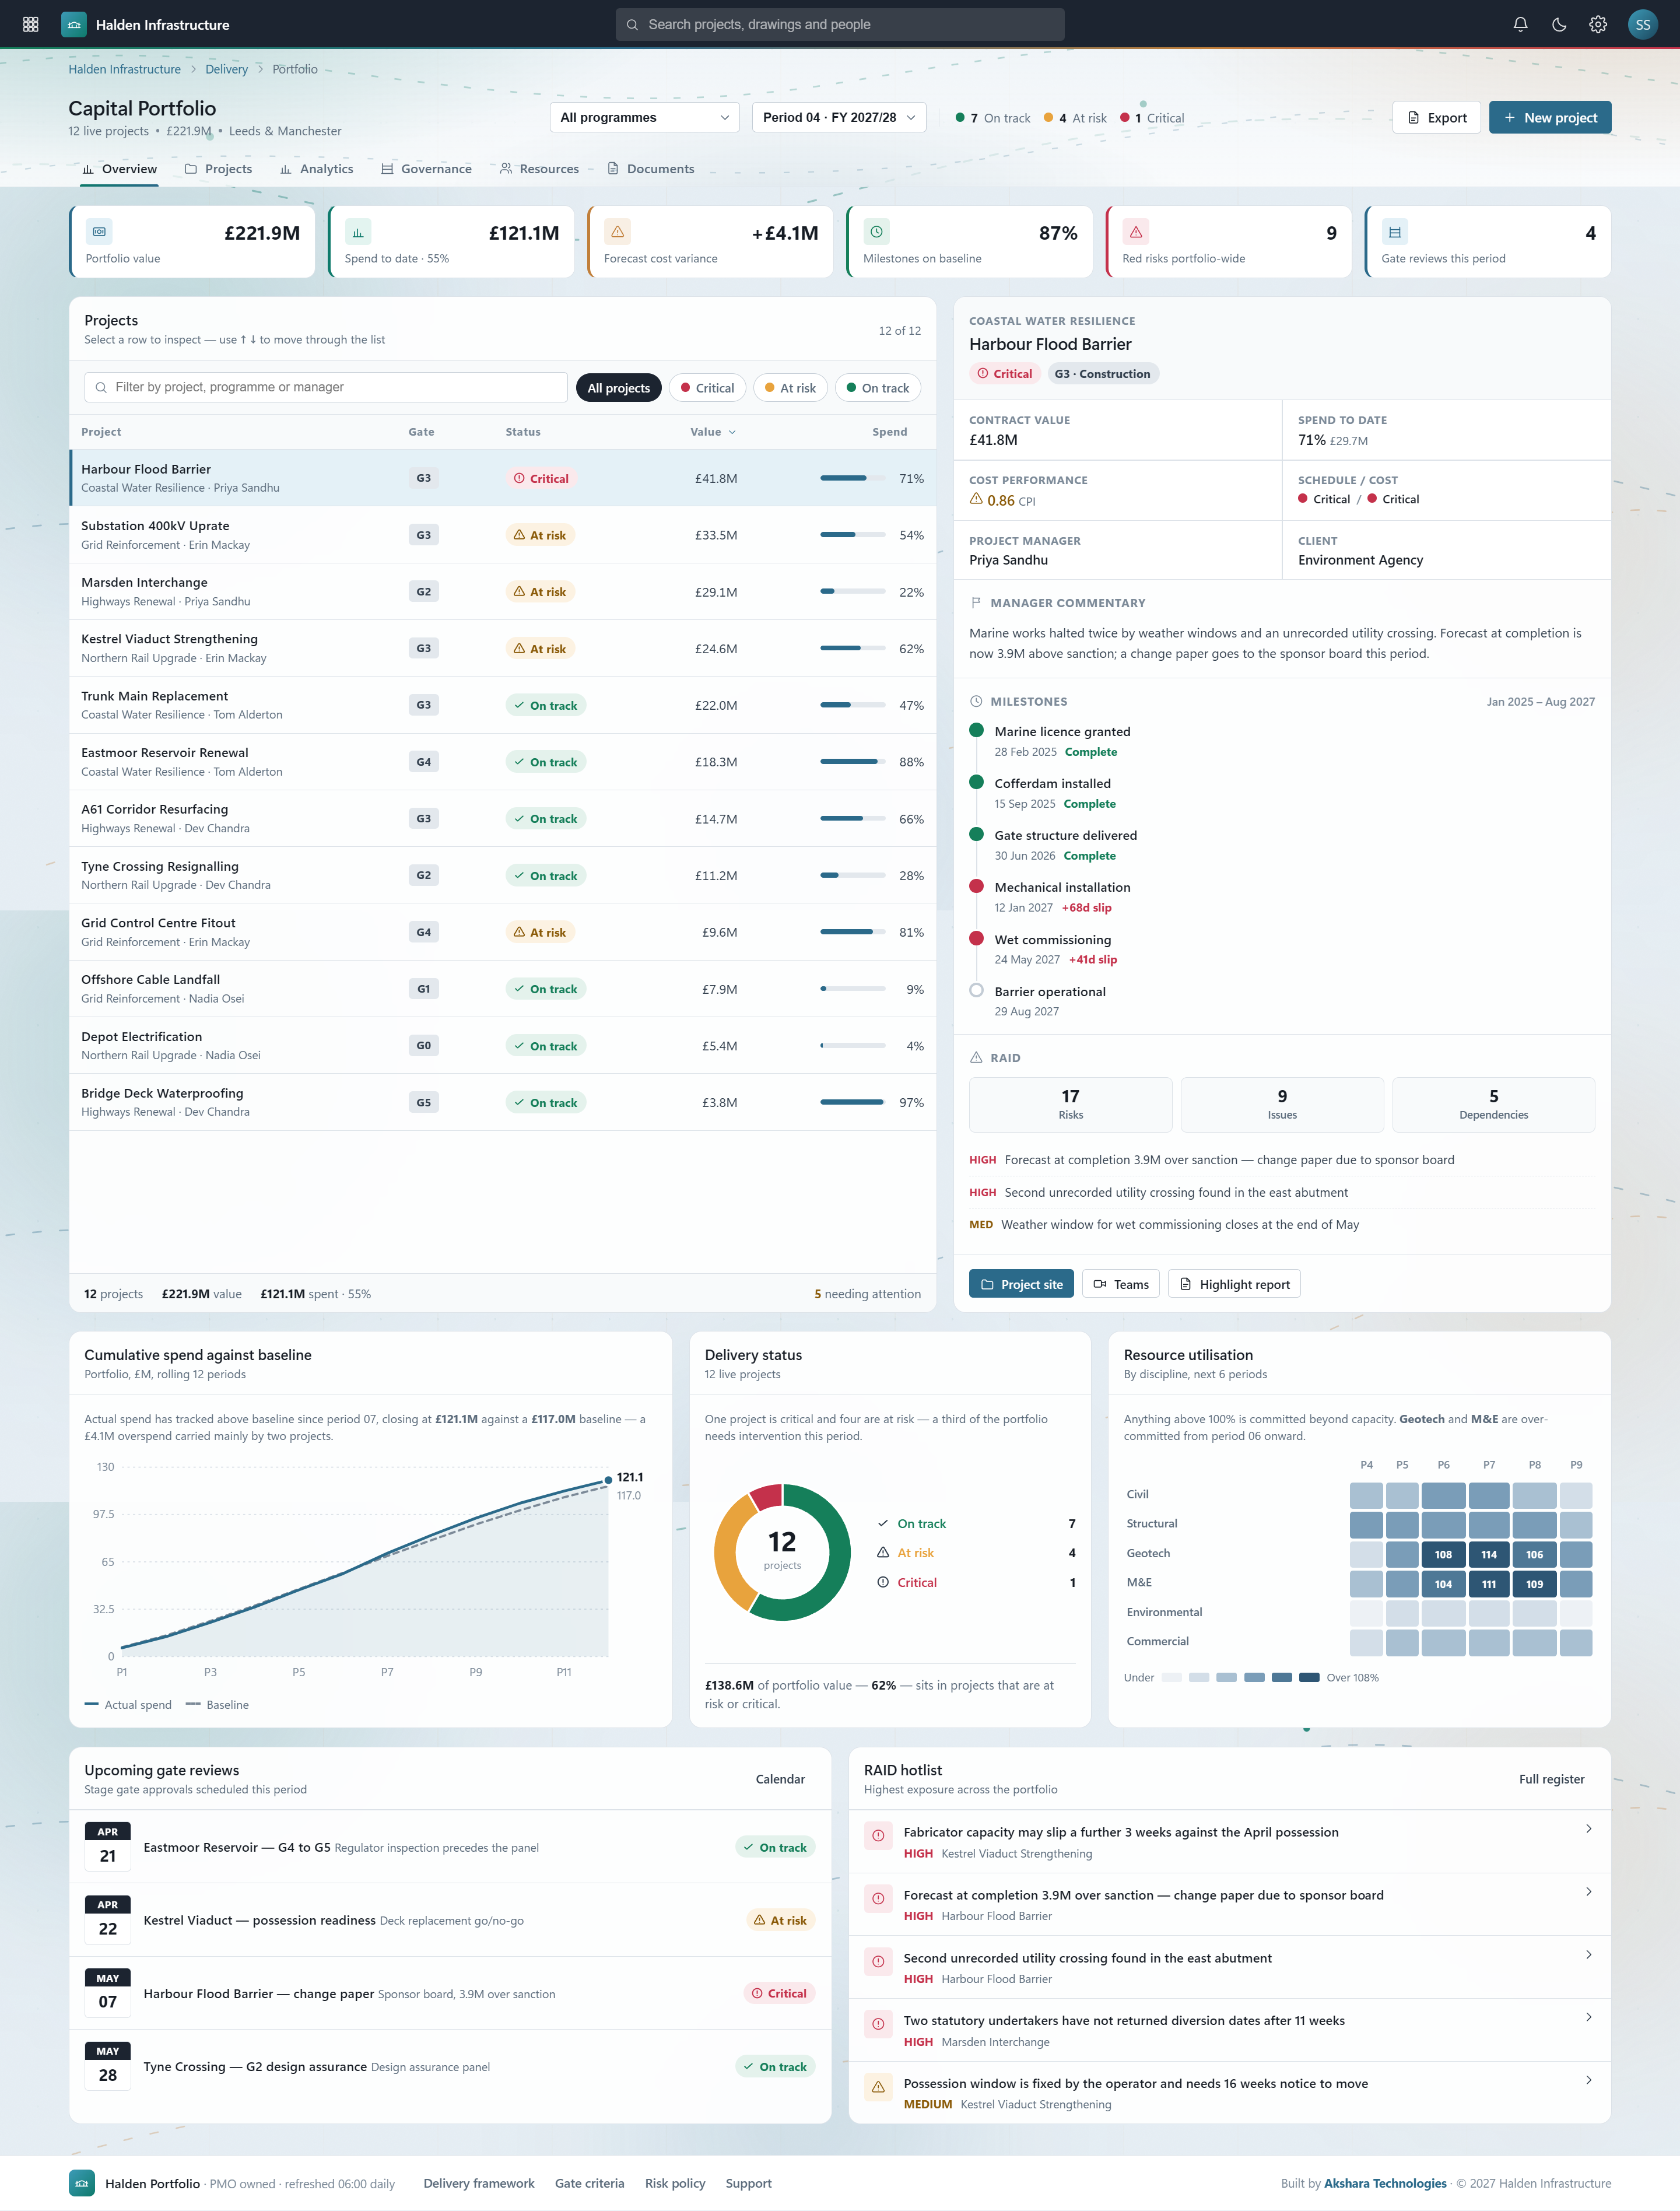
The Halden Infrastructure Capital Portfolio was built as a SharePoint Online site with a custom SPFx dashboard as the home page. Microsoft Lists holds all project records — gate stage, delivery status, portfolio value, spend to date, and forecast variance — giving a single structured source that every chart and panel reads from.
The portfolio summary KPI row surfaces £221.9M portfolio value, £121.1M spend (55%), +£4.1M forecast variance, and 87% milestones on baseline as live figures, updating as project managers update their Lists records. Below it, a project grid shows all 12 projects with gate stage badges, RAG status, value, and spend columns — click any row to open a full drill-down panel showing the project timeline, milestone list, and spend vs baseline chart.
A Power BI Embedded report handles the spend vs baseline bar chart and delivery status donut (7 on track, 4 at risk, 1 critical) with live data from the SharePoint List. The RAID hotlist is a structured List view filtered to open red risks and overdue actions, accessible from the dashboard. Gate reviews pull into an Outlook-synced calendar web part. Resource utilisation by discipline is tracked in a separate List and visualised as a horizontal bar chart in a custom SPFx web part.
What Was Delivered
Project Screenshots
Halden Capital Portfolio Hub in Action
Measured Outcomes
Board-Level Portfolio Visibility, Available Every Morning Without Assembly
Technology Stack
Built on SharePoint Online — No Primavera, No Licence Overhead
Ready to Build This?
Build a Capital Portfolio Hub Inside Microsoft 365
We design and build programme and portfolio management hubs on SharePoint Online — replacing spreadsheet reports with live dashboards, structured RAID logs, and Power BI analytics inside your existing Microsoft 365 tenant.