Executive & Finance
Dashboard Suite
SW-DS — Enterprise Client
The Challenge
Leadership Flying Blind — No Unified View of Finance or Pipeline
The SW-DS leadership team was making decisions based on data that was, at best, a week old. Finance reports were compiled manually in Excel by the finance team, passed up through email chains, and by the time they reached the executives the numbers had already moved. Pipeline data lived in a separate system — or worse, in the heads of individual sales managers.
There was no single place to see the business. Executive KPIs, department pipeline health, cash flow position, and finance metrics all existed in disconnected silos — spreadsheets, email attachments, and one-off spreadsheet reports with no common refresh cadence. Every leadership meeting began with 15 minutes of reconciling which numbers were correct.
The client needed all of this surfaced in one place, on the SharePoint intranet their team already used daily, with data that refreshed automatically — no manual compilation, no version confusion, no separate logins to separate tools.
Executive KPI data was scattered — no live overview of business health in one screen
Finance reports compiled manually in Excel — weekly cadence meant decisions were based on stale data
Pipeline data siloed across systems — no consolidated view of deals by stage, value, or department
Leadership meetings opened with 15 minutes reconciling data — time lost to version confusion, not decisions
The Solution
Four-Dashboard SharePoint Suite — One Hub, Live Data
Akshara Technologies designed and built a four-view dashboard suite deployed directly onto the client's existing SharePoint Online intranet. Each dashboard was built as a dedicated SPFx page targeting a specific audience — the executive team, department heads, the finance controller, and the sales pipeline team — with data flowing in real time from SharePoint Lists and Microsoft Graph.
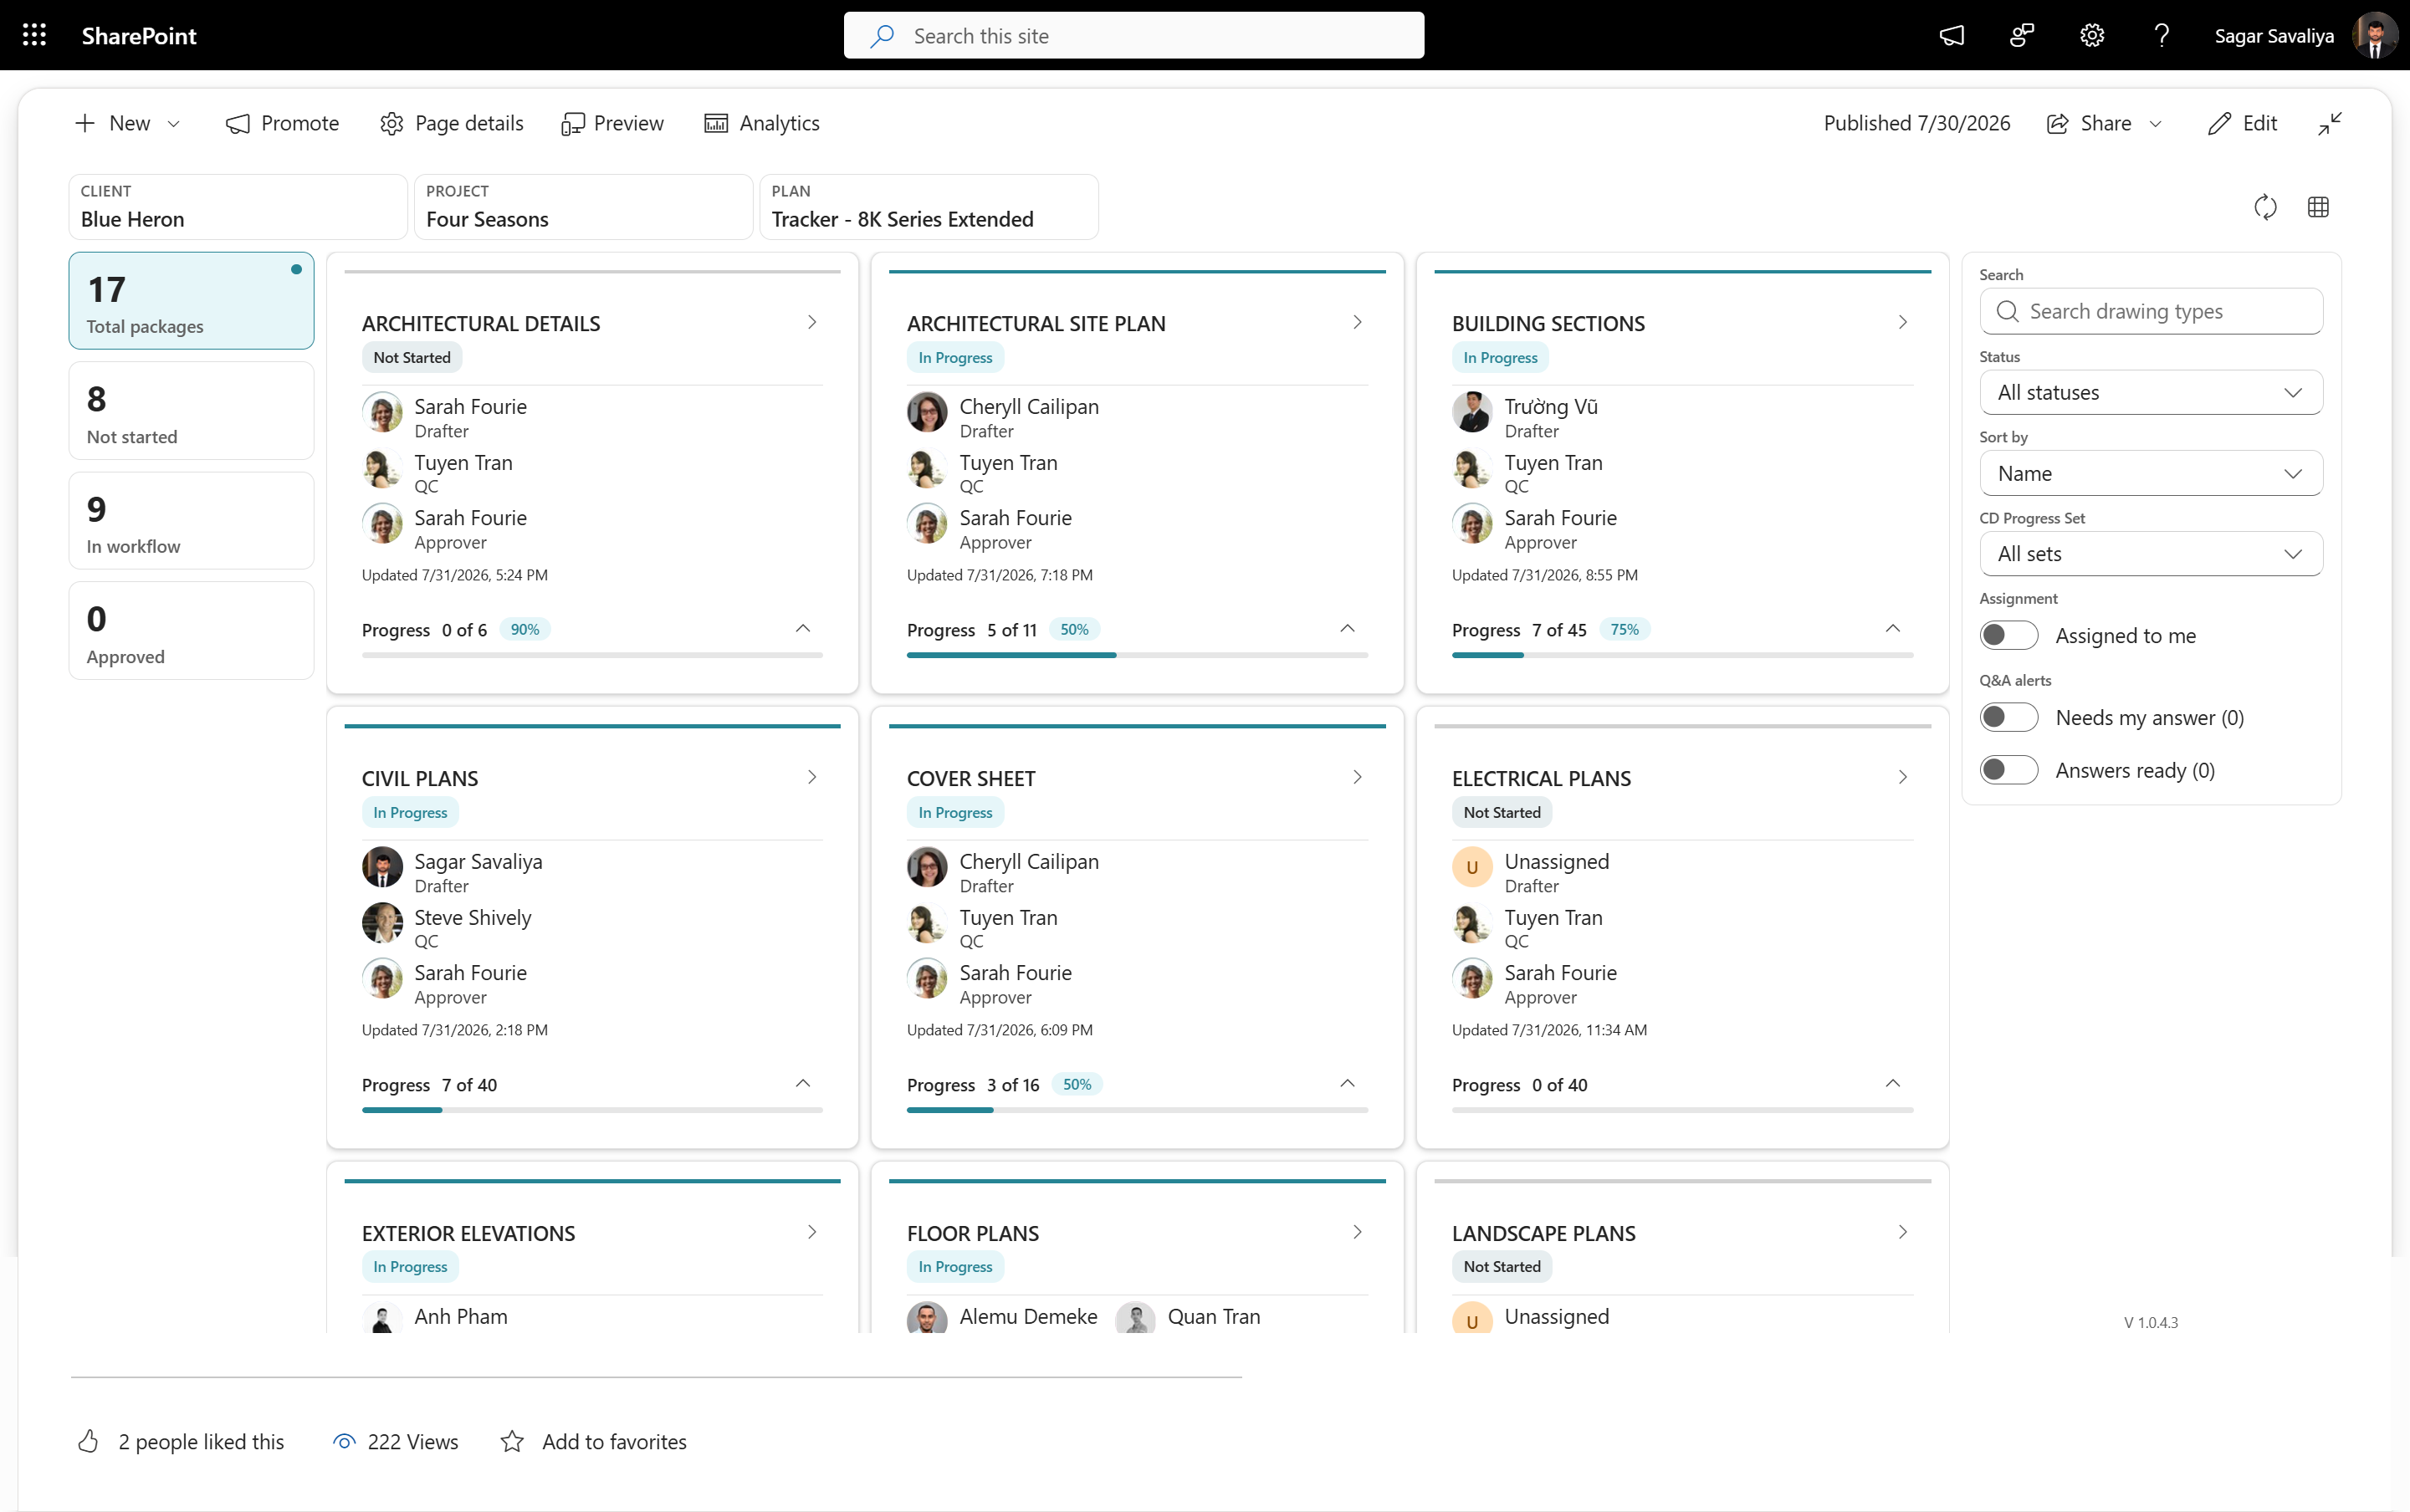
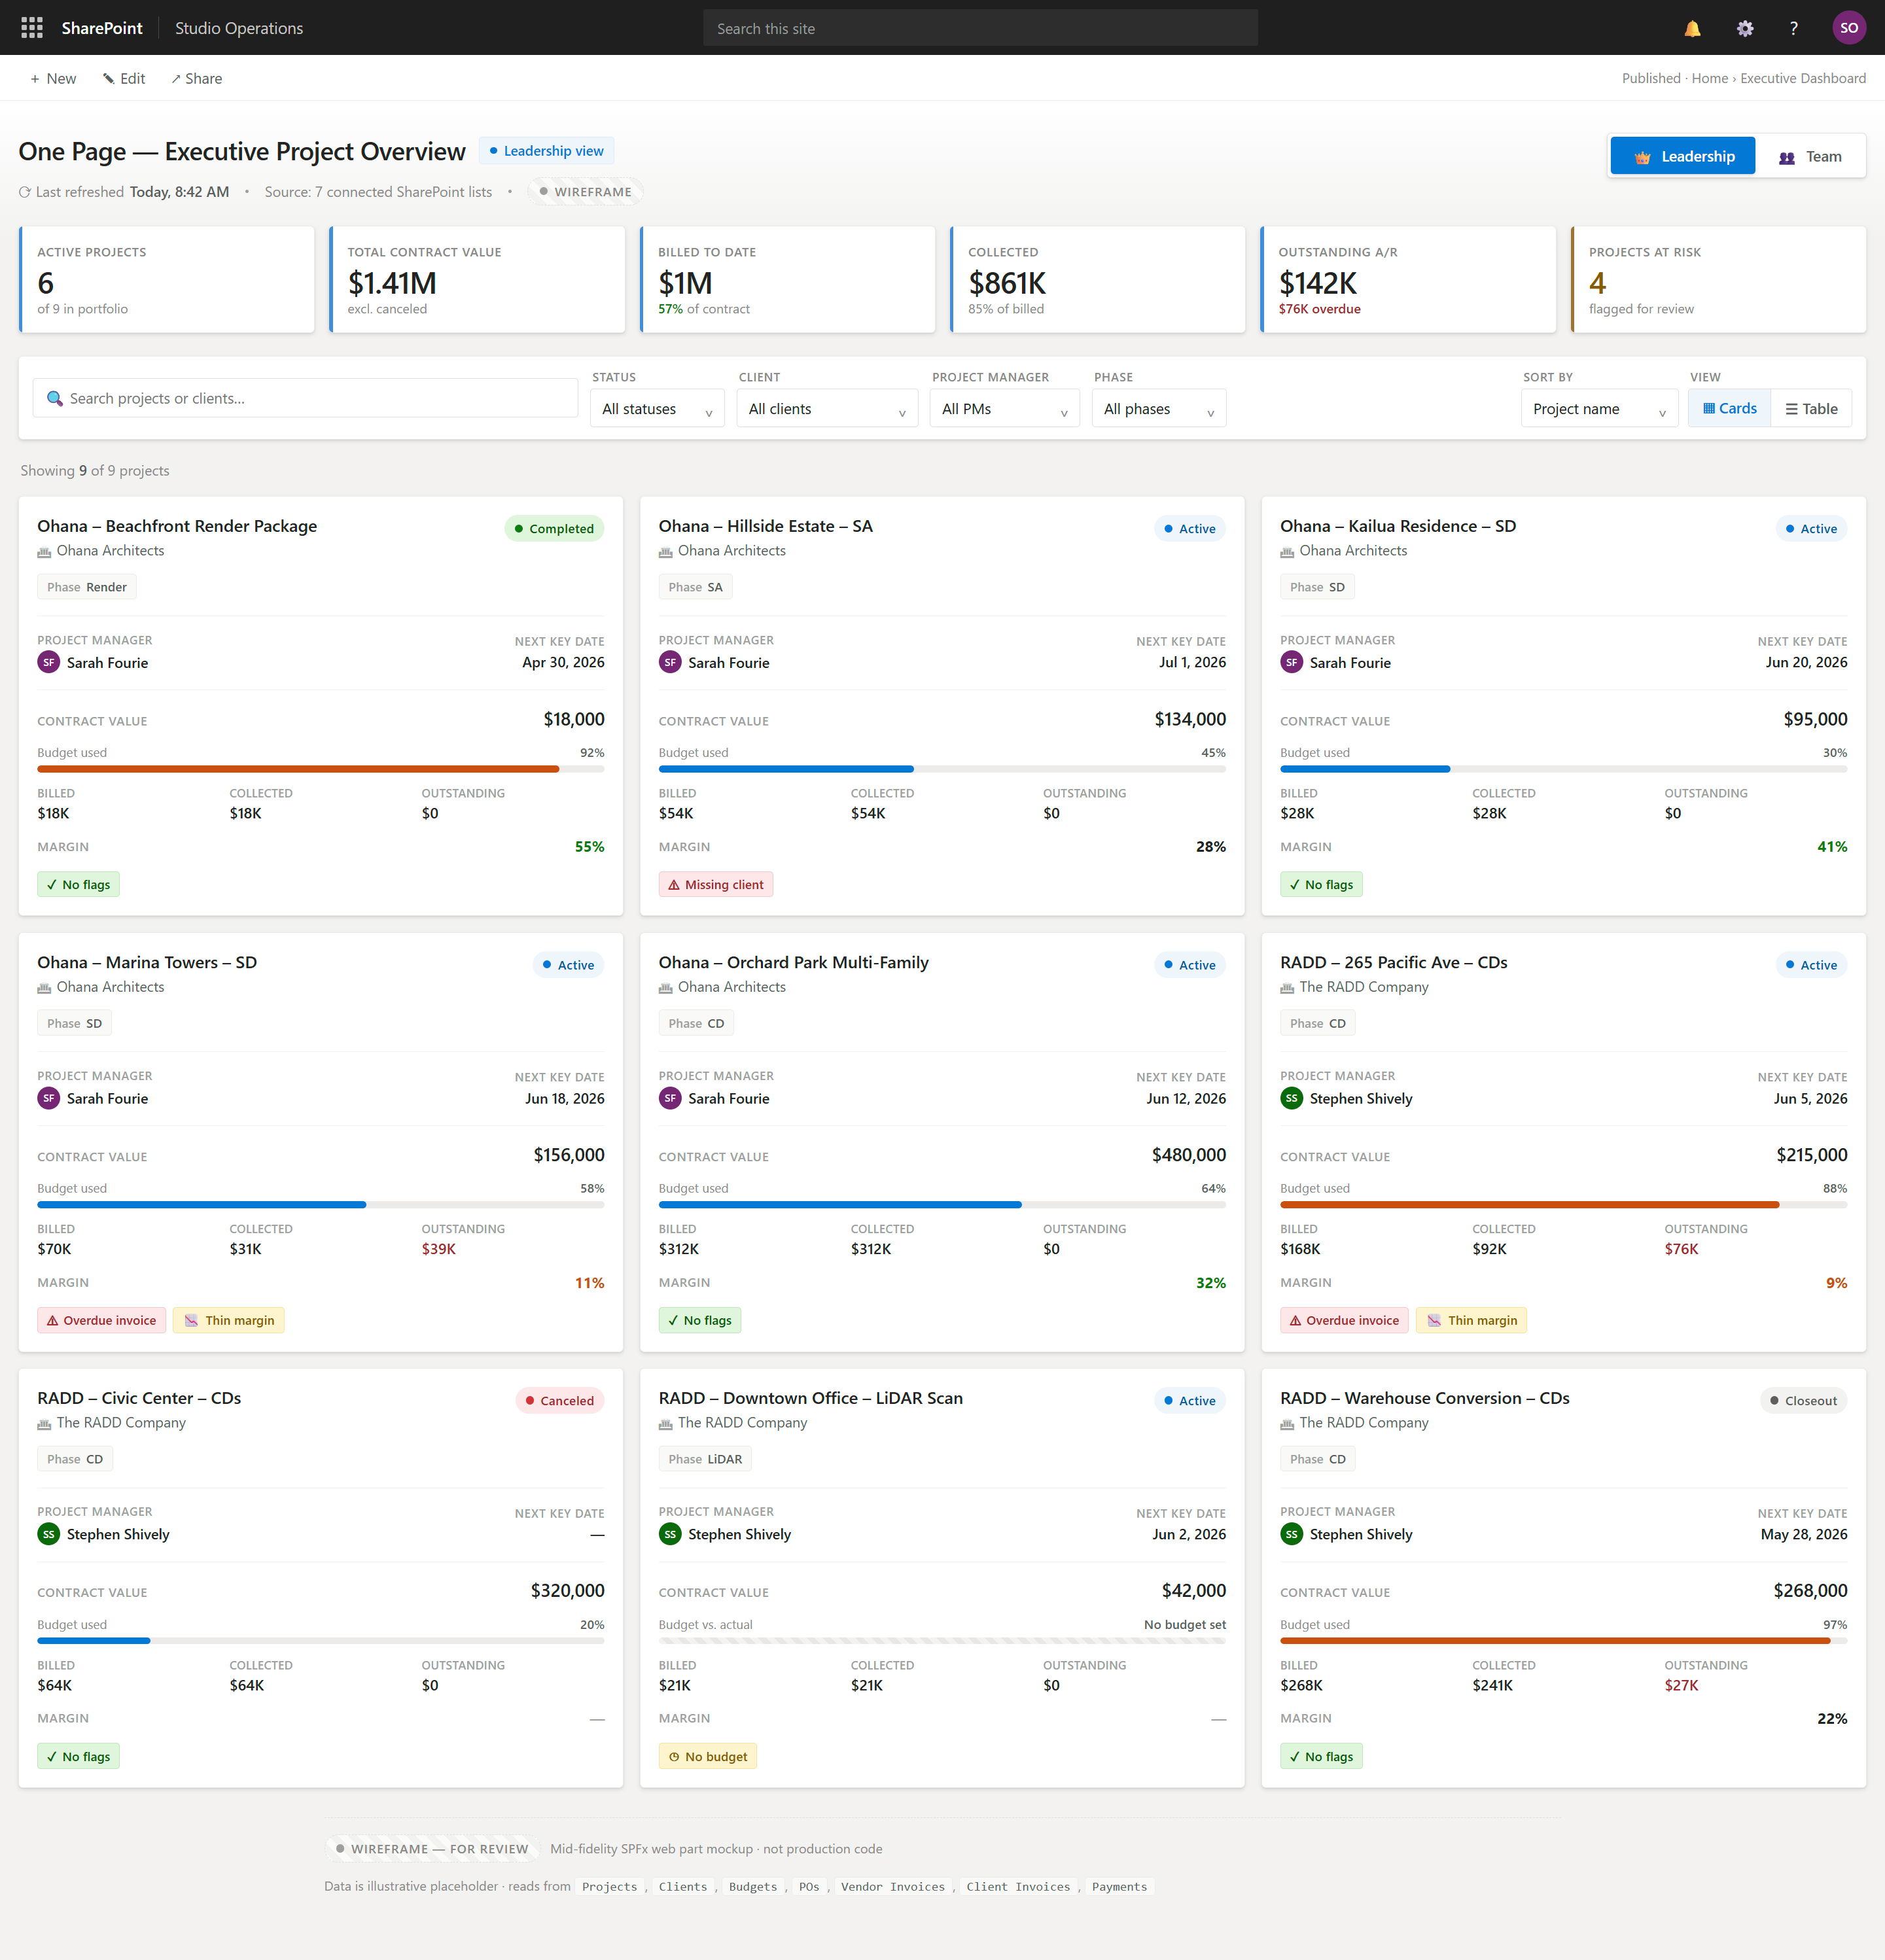
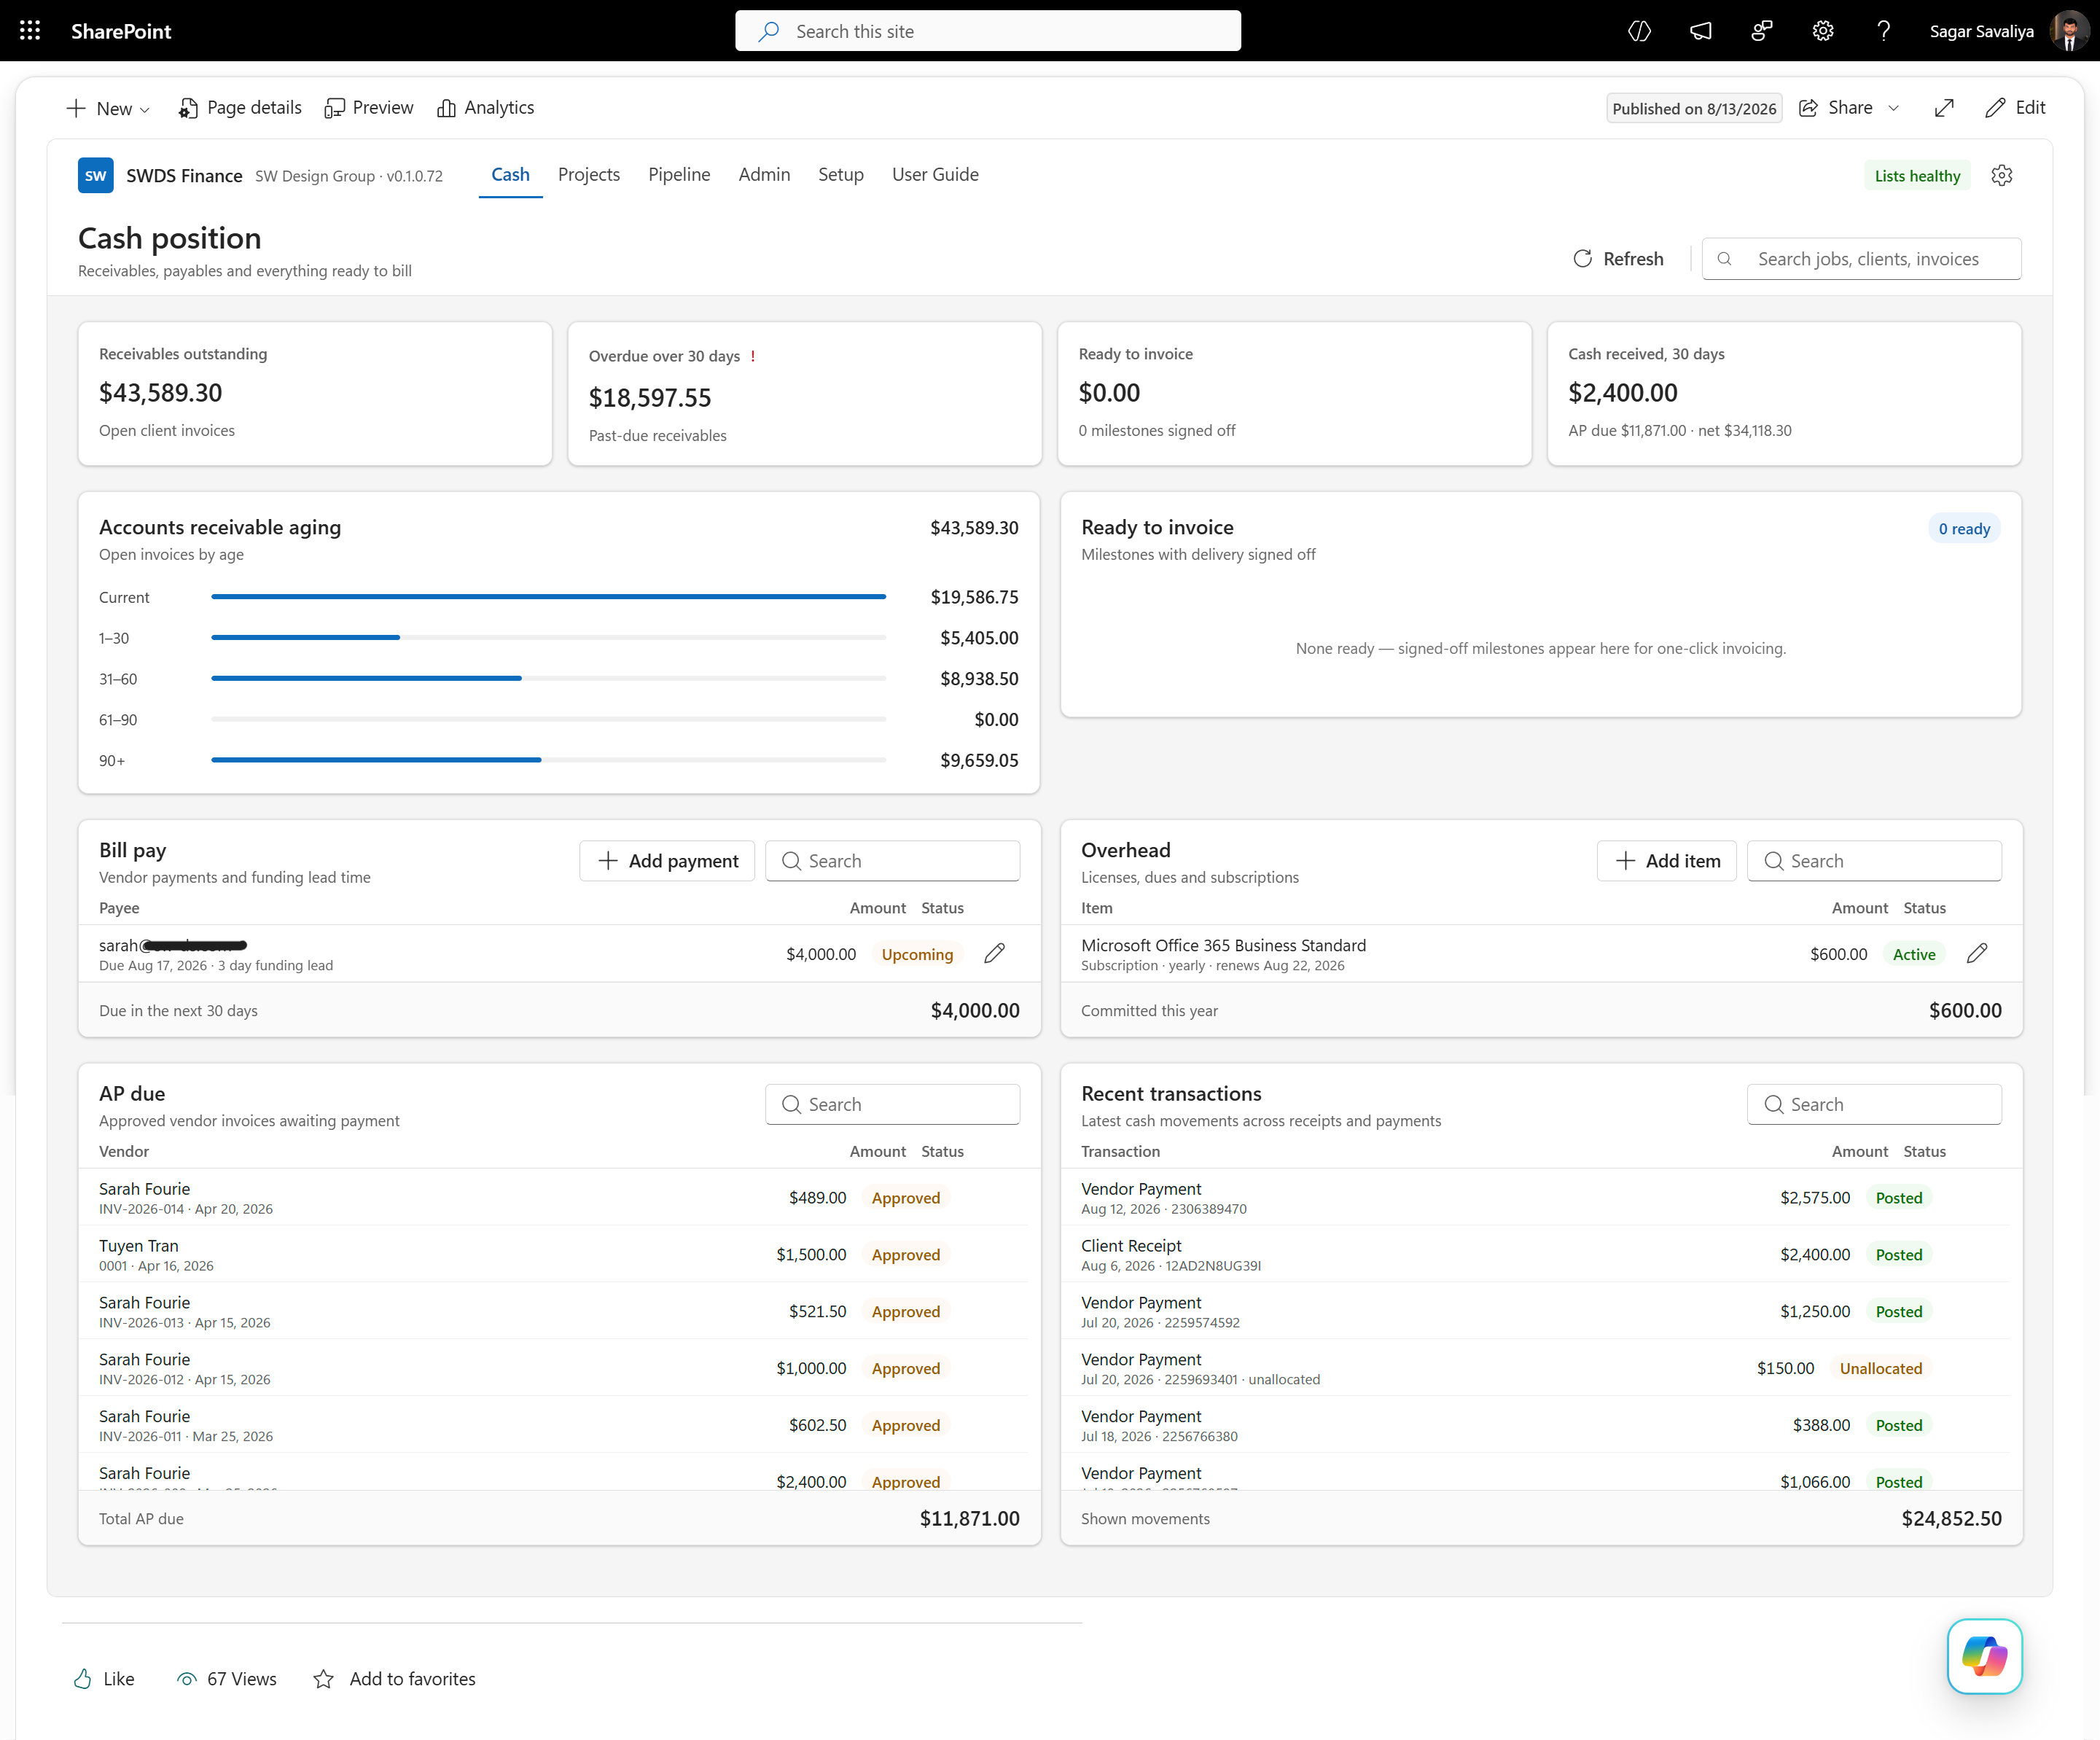
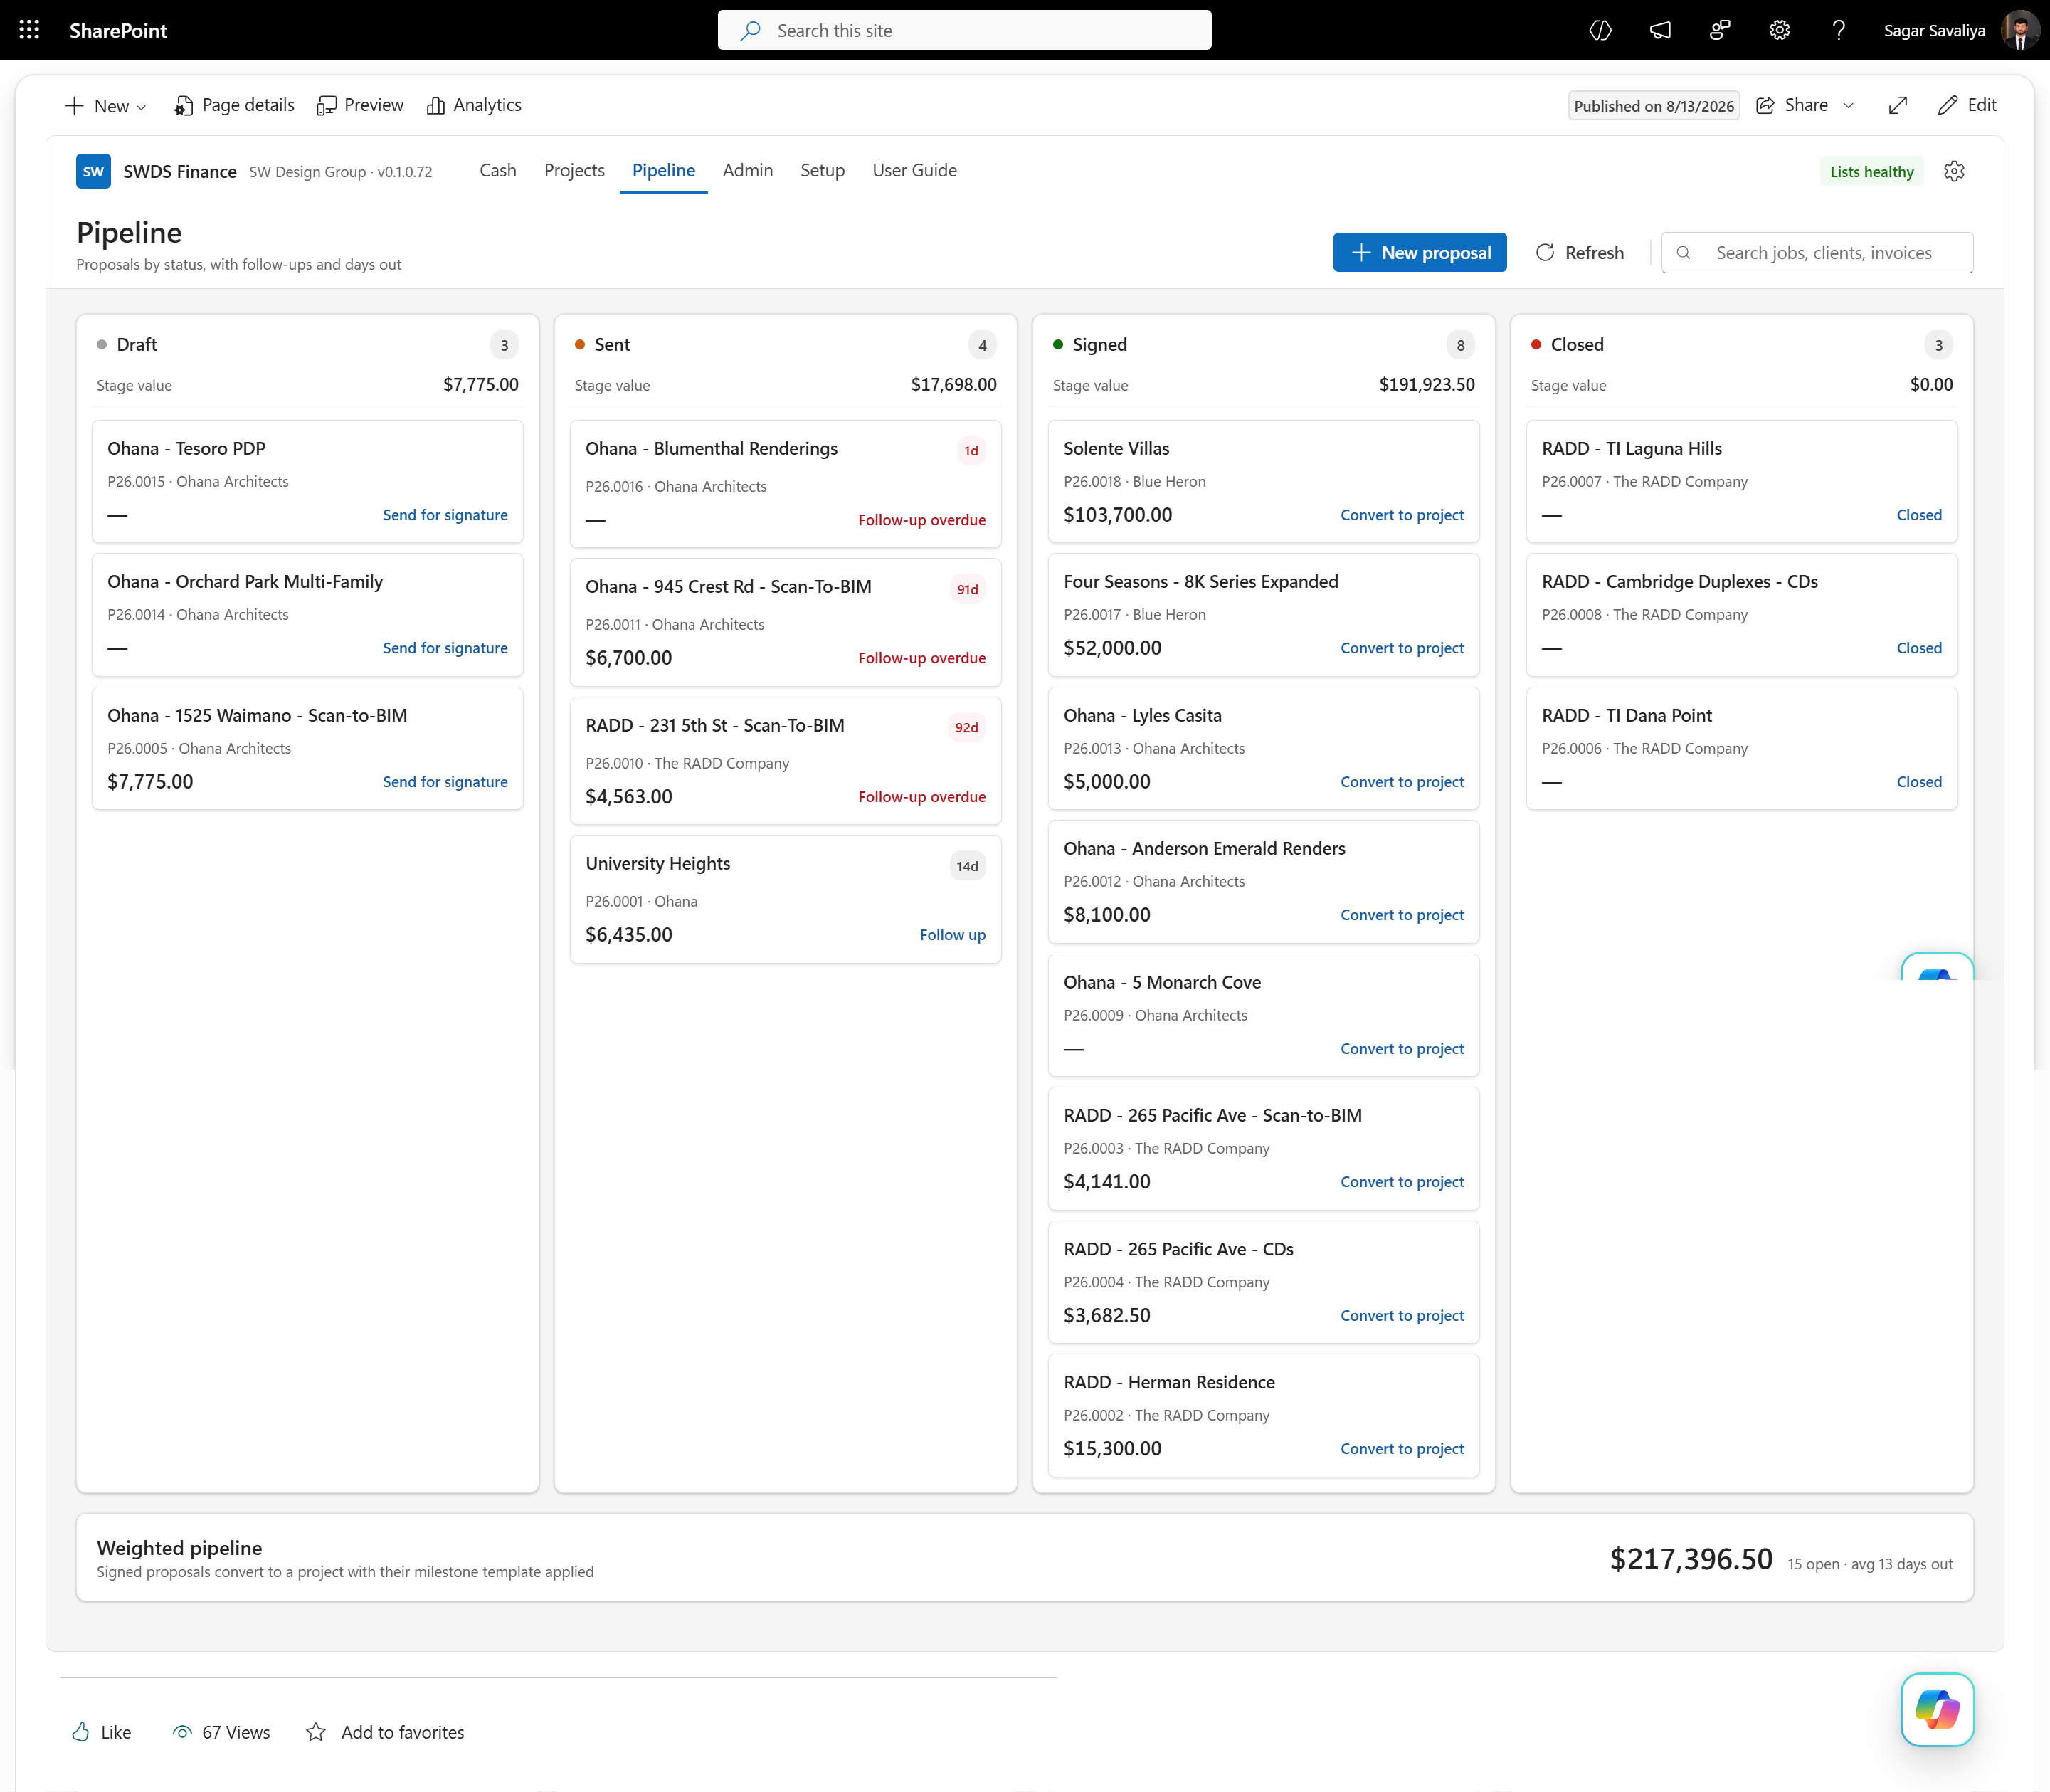
The Blue Heron executive dashboard surfaces the top-line KPIs that leadership checks first: revenue vs. target, active pipeline value, cash position, and headcount, all visible above the fold without scrolling. The executive dashboard expands this into department-level breakdowns with trend lines. The Finance Cash view gives the controller a live cash flow statement with inflow/outflow analysis. The Finance Pipeline view tracks deal stages, conversion rates, and weighted pipeline value across the sales funnel.
Power Automate flows refresh the underlying SharePoint Lists on a scheduled cadence and trigger alerts when KPIs breach defined thresholds — so the finance team no longer needs to compile anything. All four views are accessible from a single SharePoint hub page, with navigation between dashboards requiring a single click.
What Was Delivered
Measured Outcomes
Four Dashboards, One Hub, Zero Manual Reports
Project Screenshots
The Dashboard Suite in Detail
Technology Stack
Tools & Technologies Used
Start Your Project
Need a Live Dashboard
on Your SharePoint?
We build executive and finance dashboards directly into your Microsoft 365 intranet — real-time data, no manual reports, no extra tools. Your team sees the business the moment they log in.